|
|
|
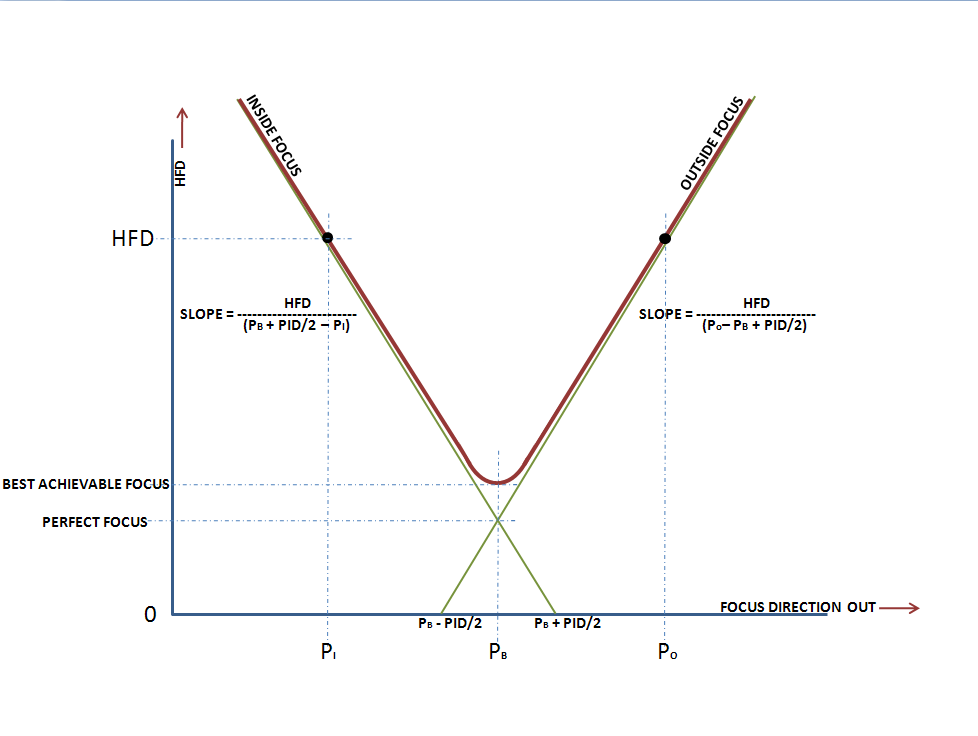
FocusMax Graphic Here's a diagram I constructed that illustrates the geometric relationships of the various parameters in the absence of noise. If you save this image on your desktop, and open it there, it will look better. P-sub-O is the position of the focuser outside of focus at the measured HFD; P-sub-I is the position inside. The PID value is the distance, in focuser units, between the two green diagonal lines where they intersect the x-axis. The numerical value of the slope is a function of the focal length and f-ratio of the telescope, and the unit of distance of one step of the focuser. The brick-red line is notional - it's probably a parabola or hyperbola. |
|
|
|
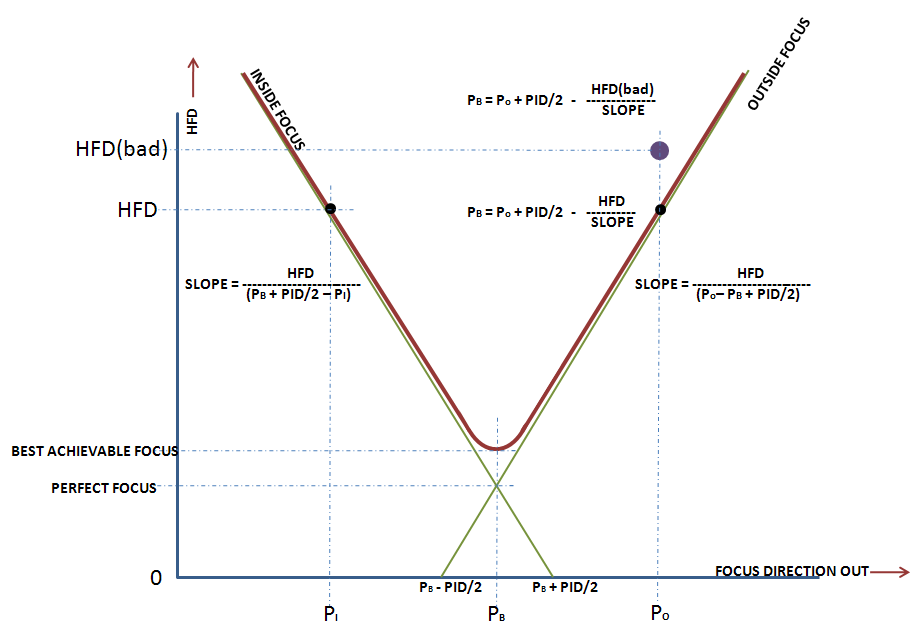
In the diagram below, we see what happens when the seeing deteriorates. First, notice that what the process is trying to do is to compute P-sub-B (best focus) from the equation shown. Given a measured HFD (black dot) and the corresponding focuser position, P-sub-O, and knowing the slope and PID from the multiply-averaged V-curve observations, which is the calibrating step in FocusMax, P-sub-B follows from the equation. When the seeing goes bad (purple bigger dot), what happens is that, at the same P-sub-O, the HFD is larger numerically -- it moves vertically up away from the best-seeing curve. This HAS to change the computed value of P-sub-B. The value of HFD(bad)/SLOPE will be larger for the degraded seeing, and thus the computed P-sub-B will be smaller (in this example of computing the best focus it will be inside the true focus). So Winfield's supposition is, I think, essentially right. It's a matter of degree, though, and the likely errors in the V-curve determination may mask this issue. |
|
|
|
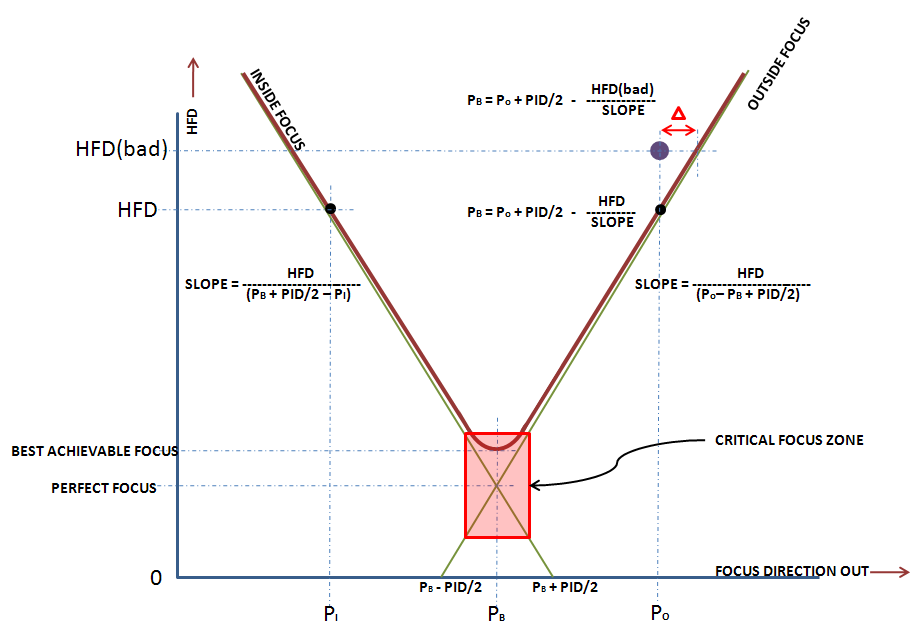
The diagram below now shows what the effect is. When there is seeing deterioration, the computed "best" focus moves
"inside" the true best focus line by an amount "delta," in red. As long as the resulting computed best focus lies inside
what Neil Fleming called the critical focus zone, there won't be a problem. Incidentally, if you were using the inside curve (that is, your preferred final move was "out"), then the computed "best" focus moves "outside" the true best focus by an amount "delta." If you could take the time to measure the HFDs on both sides, averaging the two values from the inside and outside curves should give the true P-sub-B. Now we're ready to determine how the "delta" value changes as the HFD changes due to seeing. [Footnote: in the case when the HFD changes because the focal length of the telescope changes due to temperature changes, the HFD and the P-sub-O both change proportionately, so the calculation of best focus will still give the correct result.] |
|
|
| (Watch this space.) |
|
|