|
|
| Home | History / Background | Building the Observatory | Research | Photo Album | Who Am I? |
|
EQ Tauri
(10 December 2008) |
|
EQ Tauri is a 10.5 magnitude short-period variable (p = 0.34134850 days = 492 minutes) of a class of variables of which
W Ursae Majoris is the prototype. These are eclipsers with periods shorter than 1 day, consisting of
ellipsoidal components almost in contact and having light curves for which it is impossible to specify the exact
times of onset and end of eclipses. The depths of the primary and secondary minima are almost equal or differ
insignificantly. Light amplitudes are usually less than 0.8 mag in V. The components generally belong to spectral
types F-G and later. The primary component is a main-sequence star similar to the Sun, while the secondary component
lies below and to the left of the main sequence in the H-R Diagram. The time of primary minimum is predicted by the
equation:
HJD = 2452500.1362 + 0.34134850 x CycleNo. |
|
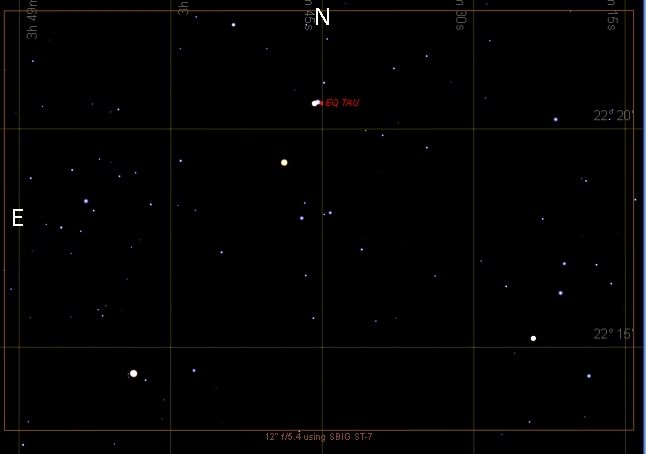
Finding chart for EQ Tauri
EQ Tau: RA(2000) = 3h 48m 13.43s Dec(2000) = +22° 18' 51.1" Frame Center: RA(2000) = 3h 48m 12.68s Dec(2000) = +22° 16' 44.2"
|
|
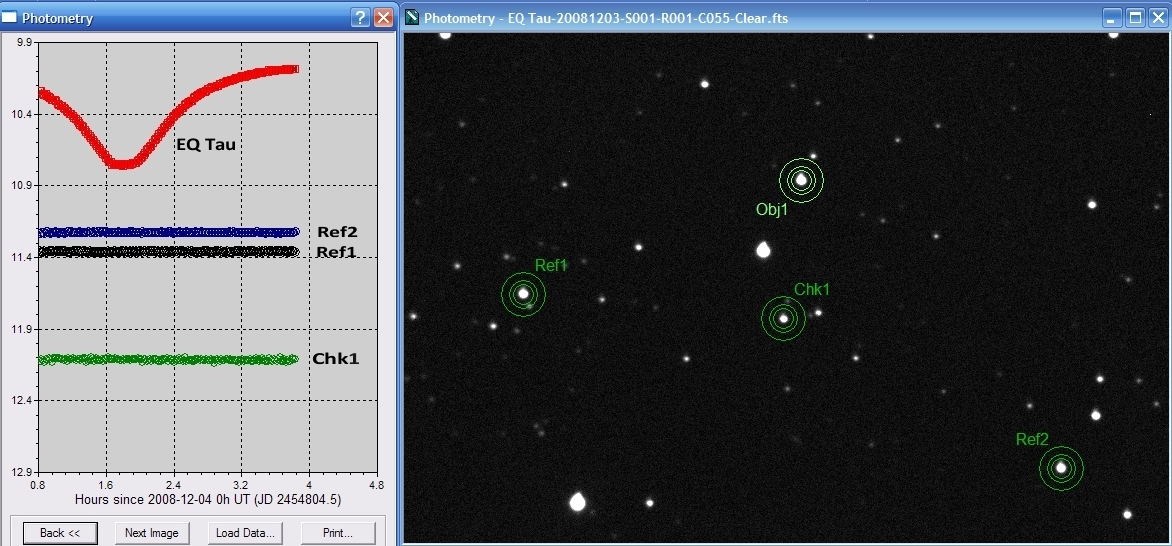
Primary minimum eclipse curves for EQ Tauri
Observations of EQ Tauri were carried out on two separate nights for a period of about three hours each night surrounding the primary minimum. Each data point represents a 50-second integration exposure using an ST-7XME CCD camera cooled to -30°C and a "Clear" filter. Each point is separated by about one minute. The ten-second difference represents the download and processing time needed before the next exposure begins. The telescope is continuously autoguided. After observing, all of the CCD images in the series are calibrated in the standard way to remove dust donuts and vignetting. The figure below shows the eclipse curve for EQ Tauri, along with the two reference stars and one check star. This is data from 03-04 December 2008 EST (cycle no. 6751), and the observed geocentric time of minimum (middle of maximum primary eclipse) was 04 Dec 2008 01:48:07 UT, or HJD = 2454804.5806. The image on the right is a single CCD frame near the time of mid-eclipse, #55 from a series of 170 images. The positions of EQ Tauri, the two reference stars and the check star are indicated in the image and on the graphic. The graphic is generated by MaxIm DL/CCD, using the photometry tool.
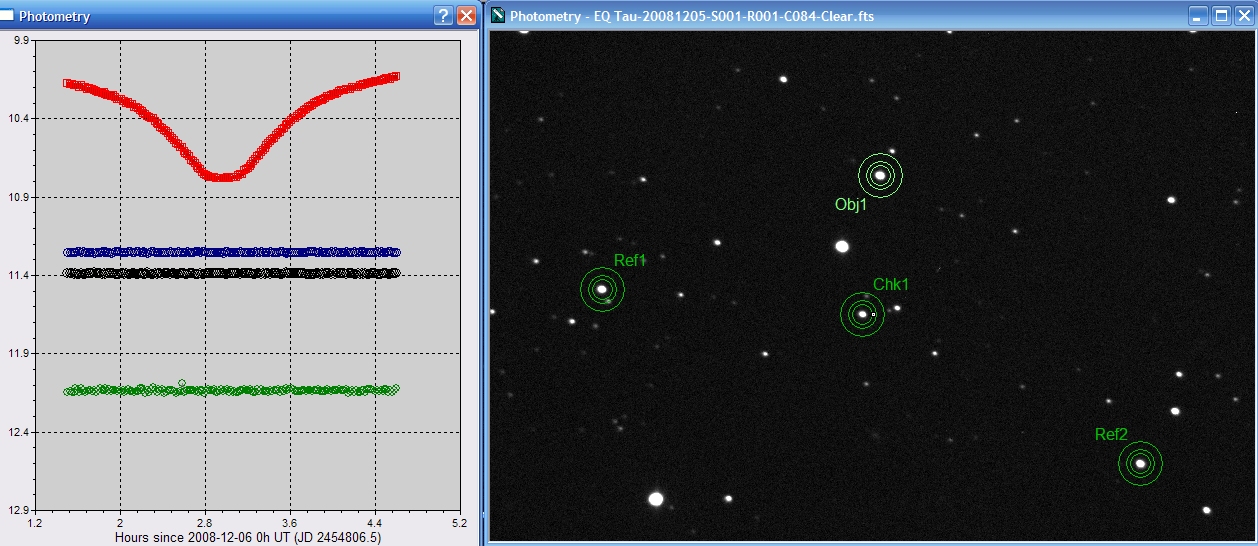
This next figure below shows EQ Tauri, along with the same reference and check stars, from data from 05-06 December 2008 EST, six eclipse cycles (cycle no. 6757) later. The observed geocentric time of minimum was 06 Dec 2008 02:57:47 UT, or HJD = 2454806.6290. The image on the right is #84 in a series of 175 images.
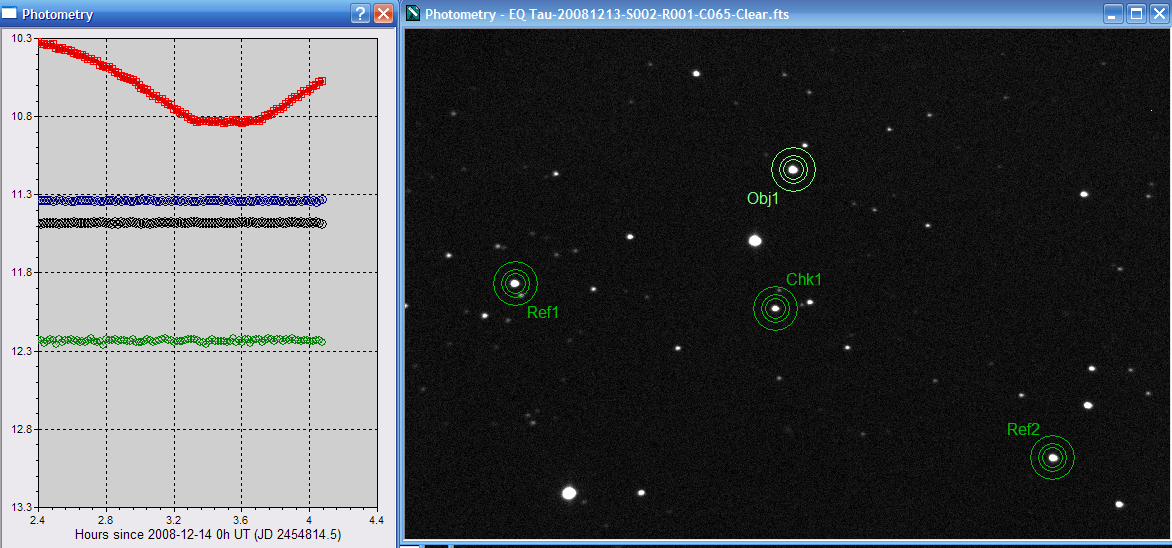
The third figure below shows the secondary minimum of EQ Tau, along with the same reference and check stars, from data from 13-14 December 2008 EST, at cycle no. 6780.5. The observed geocentric time of mid-eclipse was 14 Dec 2008 03:29:32 UT, or HJD = 2454814.6507. The image on the right is #65 in a series of 97 images.
|
|
Things to Note
These are preliminary results, based only on inspection of the light curves and corresponding CCD images. The
equations used to generate heliocentric predictions for primary minimum were corrected to get a geocentric UT
time for the predicted minima. The observed geocentric UT time of primary minimum is determined from the light curve,
and corrected again to determine the observed heliocentric Julian date of mid-eclipse.
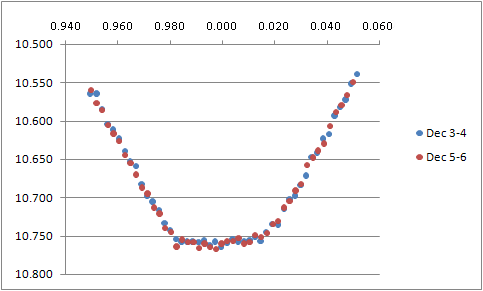
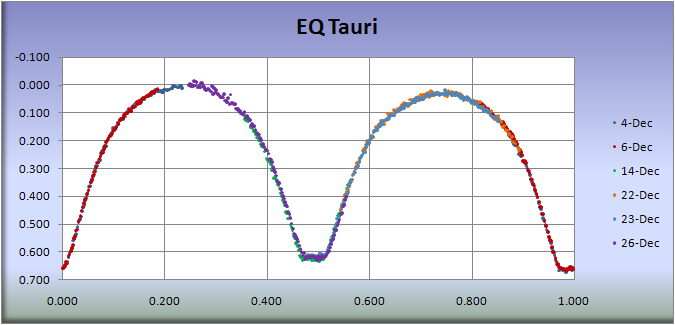
The magnitudes shown on the graphics are instrumental magnitudes, and they have not been transformed to a standard photometric system. Nevertheless, the "constant" values for the magnitudes of the reference and check stars demonstrate (if we didn't know it already) that the telescope-CCD system and evening conditions were stable, and that the variations seen in the variable star light curve are real. If you look carefully, you will notice that the light curve is not quite symmetric about the middle of the primary minimum - that is, the slope of the descending and ascending curves do not superimpose if reflected about the mid-point. This may be a consequence of real differences caused by astrophysical phenomena occurring in the space between these contact binary stars. But it could also be the result of the data having not been transformed to a photometric standard system. As the eclipser is rising in the sky during the observing run, the effect of changing atmospheric extinction would be to make the instrumental magnitudes systematically brighter after eclipse. The two sets of data are six cycles apart, so we only see the primary minima, not the secondary minima, which would be .17 day (about 245 minutes) later than the ones shown above. From my observing site, trees constrain the longest manageable observing run to about 3½ hours. I cannot collect data from both minima in one observing run. The eclipses appear to be annular/total, evidenced by the nominally flat bottom of the light curve during maximum eclipse. The light curves of partial eclipses would look different, coming to a minimum at a point only. The figure below shows the data from the two nights superimposed in phase and magnitude. The duration of "totality" is about 0.04 in phase, or about 19 minutes. (The third night's data shows the duration of "annularity" is about 24 minutes, or 0.05 in phase.) Interestingly, these light curves are somewhat different from the published light curves shown by Yang and Liu (2002). Their observations were of 100-second integration times and alternating B-V-B-V-B-V... filters and thus might not have enough resolution in time to reveal the flat bottom of the eclipses. Note that W Ursae Majoris-type eclipsing binaries are not typically described as having light curves with flat-bottom minima.
One last note - These eclipses are coming about 17 minutes early compared to the equation above for the predicted minimum. This is evident from the displacement of the primary minimum to the left on the above diagram (by about 0.012 in phase.) |
|
References
● SIMBAD basic data
● SIMBAD clickable finding chart ● Aladin preview image ● Yang, Y., & Liu, L., 2002, Astronomical Journal, 124, 3358ff: A Photometric Study of the Eclipsing Binary EQ Tauri ● Reference Literature |
|
|
|
This data and information on this page are Copyright © 2008-2009, Richard A. Berg, Washington, DC
|