|
|
| Home | History / Background | Building the Observatory | Research | Photo Album | Who Am I? |
|
SW Cancri
(5 March 2009) |
|
SW Cancri is another Algol-type eclipsing systems (p = 1.799202 days). These are binaries with spherical
or slightly ellipsoidal components. It is possible to specify, for their light curves, the moments of the
beginning and end of the eclipses. Between eclipses the light remains almost constant or varies insignificantly
because of reflection effects, slight ellipsoidality of components, or physical variations. Secondary minima
may be absent. An extremely wide range of periods is observed, from 0.2 to >= 10,000 days. Light amplitudes
are also quite different and may reach several magnitudes. In the case of SW Cancri, this amplitude is over
1 magnitudes. This binary is a well-studied one, with numerous references in the literature. The time of
primary minimum is predicted by the equation:
HJD = 2452501.7420 + 1.799202 x CycleNo. |
|
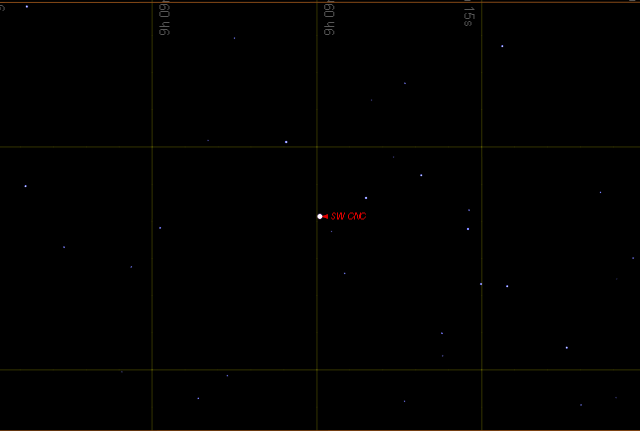
Finding chart for SW Cancri
SW Cnc: RA(2000) = 09h 08m 59.322s Dec(2000) = 9° 35' 41.00"
|
|
Eclipse curves for SW Cancri
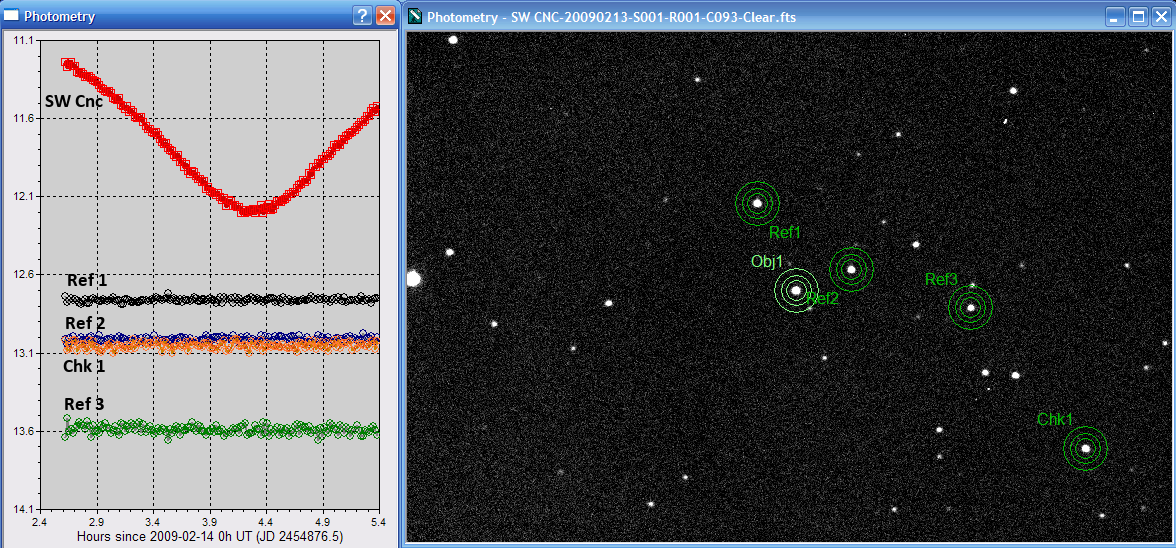
Observation of SW Cancri was carried out on three nights for a period of about three hours each night. Each data point represents a 50-second integration exposure using an ST-7XME CCD camera cooled to -30°C and a "Clear" filter. Each point is separated by about one minute. The ten-second difference represents the download and processing time needed before the next exposure begins. The telescope is continuously autoguided. After observing, all of the CCD images in the series are calibrated in the standard way to remove dust donuts and vignetting. The figure below shows the eclipse curve for SW Cancri, along with three reference stars and a check star. This is data from 13-14 February 2009 EST (cycle no. 1320), and the observed geocentric time of minimum (middle of eclipse minimum) was approximately 14 Feb 2009 04:15:57 UT, or HJD = 2454834.76713. The image on the right is a single CCD frame near the time of mid-eclipse, #93 from a series of 155 images. The positions of SW Cancri and the reference stars are indicated in the image and on the graphic.
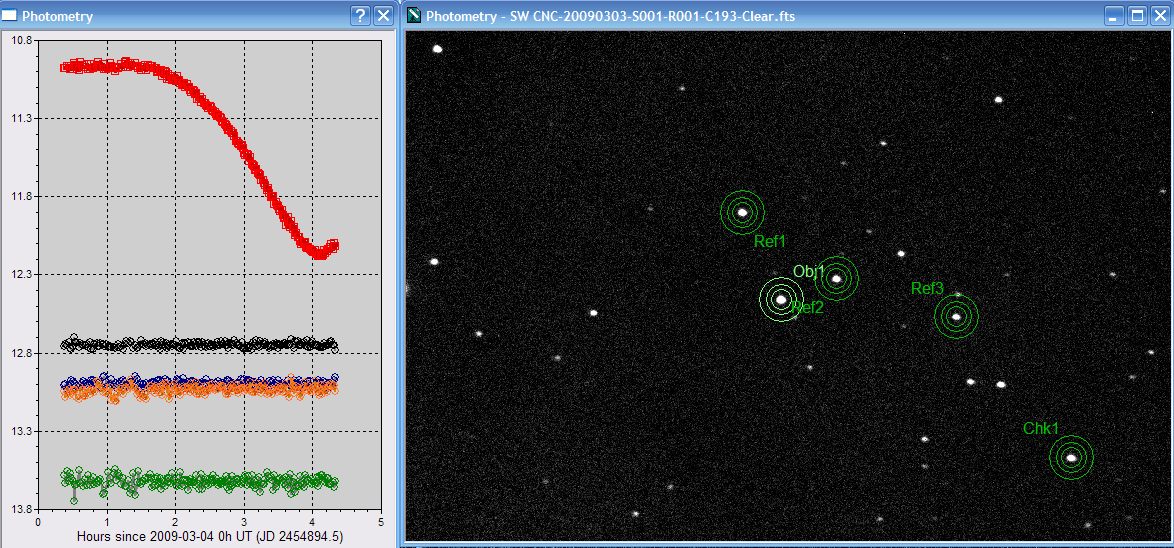
Below is data from 03-04 March 2009 EST (cycle no. 1330), primary minimum. The observed geocentric time of minimum (middle of eclipse minimum) was approximately 04 Mar 2009 04:05:03 UT, or HJD = 2454894.67525. The image on the right is a single CCD frame near the time of mid-eclipse, #191 from a series of 205 images. The positions of SW Cancri and the reference stars are indicated in the image.
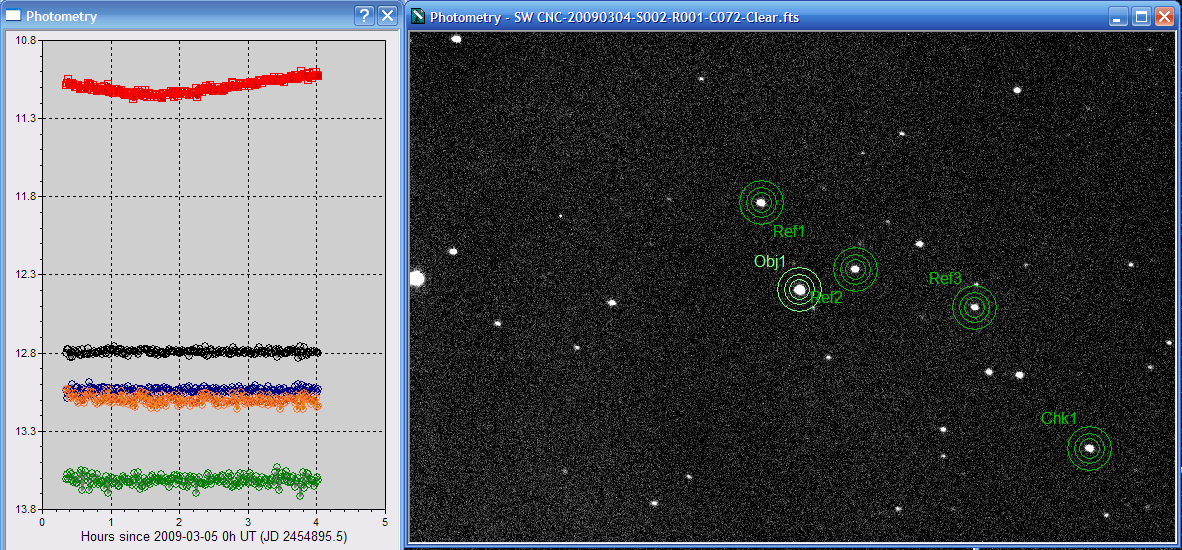
Below is data from 04-05 March 2009 EST (cycle no. 1330), secondary minimum. The observed geocentric time of minimum (middle of eclipse minimum) was approximately 05 Mar 2009 01:40:43 UT, or HJD = 2454895.57498. The image on the right is a single CCD frame near the time of mid-eclipse, #74 from a series of 205 images. The positions of SW Cancri and the reference stars are indicated in the image.
|
|
Things to Note
These are preliminary results, based only on inspection of the light curves and corresponding CCD images. The
equations used to generate heliocentric predictions for primary minimum were corrected to get a geocentric UT
time for the predicted minima. The observed geocentric UT time of primary minimum is determined from the light curve,
and corrected again to determine the observed heliocentric Julian date of mid-eclipse.
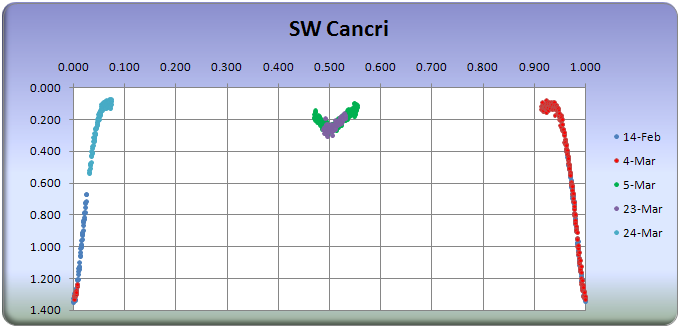
The magnitudes shown on the graphics are instrumental magnitudes, and they have not been transformed to a standard photometric system. Nevertheless, the "constant" values for the magnitudes of the reference and check stars in the images above demonstrate that the telescope-CCD system and evening conditions were stable. This light curve is typical of Algol-type eclipsing binaries, but many more observations will be needed to depict the whole light curve. With a 7+ day period, and partial eclipses occurring, it could be many weeks before additional observations are forthcoming, given my three-hour observing window. The primary minimum reaches a depth of about 1.2 magnitudes, and it is about one magnitude deeper than the secondary minimum. All available data are shown in the figure below.
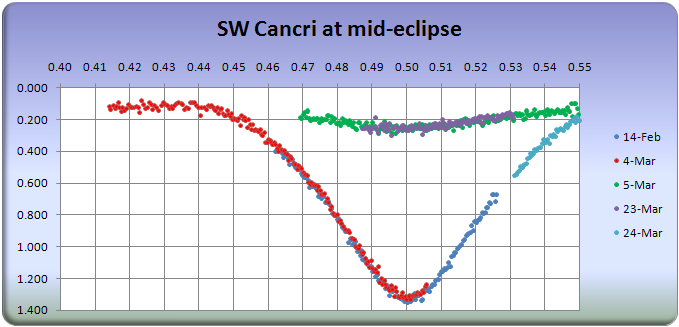
Last, here is an exploded view of several nights of data during primary and secondary minimum. There is no evidence of a flat bottom to these light curves, indicating that the eclipses are partial.
|
|
References
|
|
|
|
This data and information on this page are Copyright © 2008-2009, Richard A. Berg, Washington, DC
|